
The National Center for Access to Justice recently put in place a number of corrections offered by 21 states to the Justice Index, so its time to take a look and see what we learn.
The most important point is that 21 states did correct data — in other words they care enough about their score to do so. This is very reassuring, since it means that states are not putting their energy into debunking the score, but rather want to look good. Hopefully this means that the Index is doing just what it was meant to do — help generate a “race to the top.”
From a national policy point of view, sorting the best practices charts to show the penetration of each practice is fascinating. Here is the sorted chart for self-represented best practices.
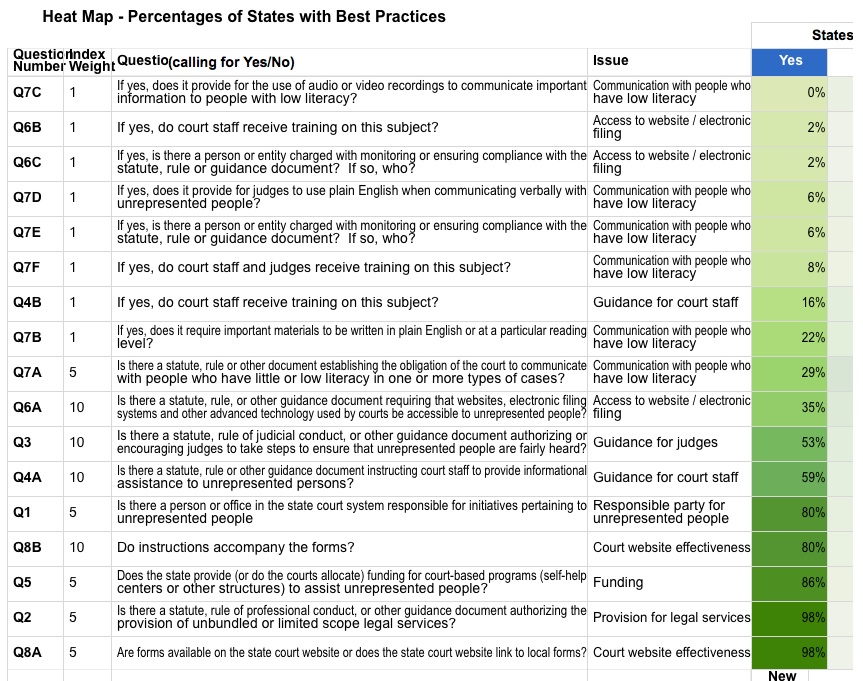 As a general matter, it is notable how many of what I think all would now agree ar e”Best Practices” are scoring relatively low (e.g. 8% training on low literacy communication; 16% training on guidance for court staff on handling SRLs; 53% court guidance for judges.)
Moreover, even the good scores raise questions, as all data should. You can see that 98% of states report at least some forms available — showing that there is a theoretical consensus about the value of forms. (That last state had better get a move on!) Of course this tells us nothing about how many states have anything like the full suite of needed forms. I am deeply skeptical that many do, and take this result more as showing that while the principle is largely accepted, there is still a huge amount of work to be done even in this focused area. Nor does this number deal with plain English, with automation, e-filing, or “mandatory acceptance” — that there is a form for each situation that every court in the state must accept. I am confident that the next version of the Index will delve much more into these issues. This analysis also highlights how valuable the Index is as a beginning point for discussion.
I would encourage states to see how they do in these individual comparisons, and try to understand why they are off where they should be. Given the overall scores, no one should be discouraged, and all should be challenged.
I would similarly urge those involved at the national policy level to use all these results, in each of the four areas, to help build an overall picture of where the opportunity and need is most focused.
On a different topic, I am also struck by the fact that SRL access scores does correlate, but only relatively weakly with median income.
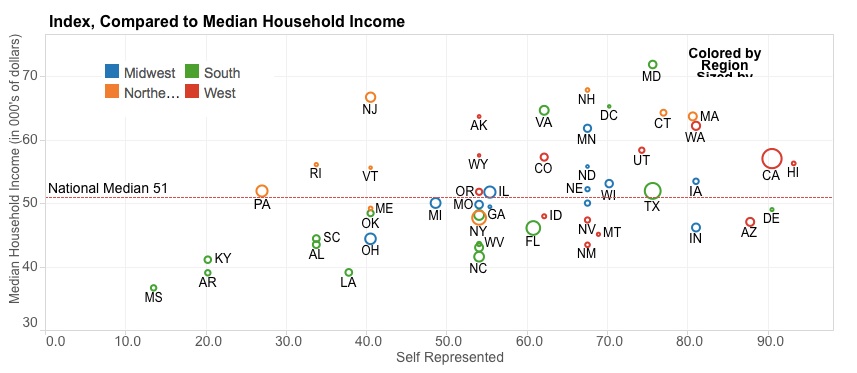 The formal statistical tests would be interesting, and others may disagree, but it seems to me that while there is a some correlation, particularly for the very poor states, there is a quite a lot of distance from the line.
Finally, I hope to blog soon about the exciting range of local attention this, and other innovations are receiving. I think we can thank Voices for Civil Justice –as well as all those who cooperate with it — for the fact that the media is finally “getting it.”
Congratulations to all who made this project possible. The range and size of the team is itself an important lesson.

