
I do not think of myself as someone who “gushes” about every innovation, but this is so wonderful.
If you were ever skeptical about the value of mapping and GIS for access to justice, just look at these and change your mind.
The link shows the whole story of the hurricane, all the way through to the scale of legal vulnerability across the state.
Here are two of the many maps, the physical impact, and the impact on the legal vulnerable:
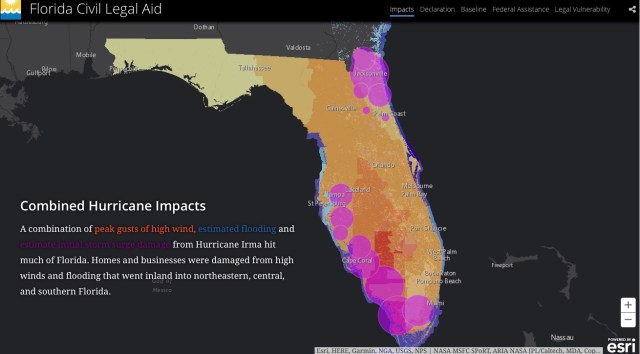
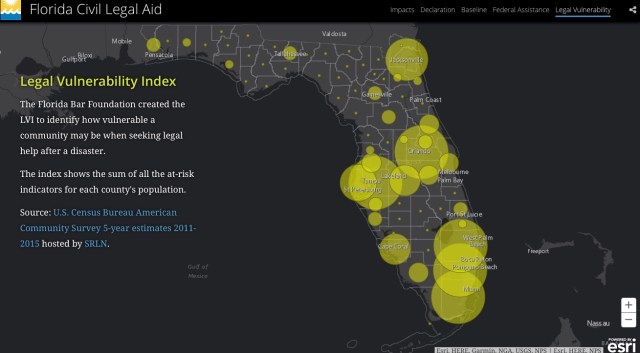
The overlap is astonishing, and crystal clear from comparing these two.
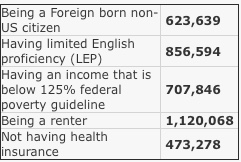
The Legal Vulnerability Index is itself a fascinating idea, and one that has many potential implications. Below is the way it was calculated for Miami-Dade:
These three slides are only a tiny subset of the visualized data, which also include Federal response. Do look at the whole document, which is here. Ask yourself how this approach can help with 100% access planning.
Congrats to SRLN (map gallery) and FBF.

