
That’s right, a tool that lets you plot languages by area.
Here is the national Spanish language graph (with each dot representing about 100 people.)
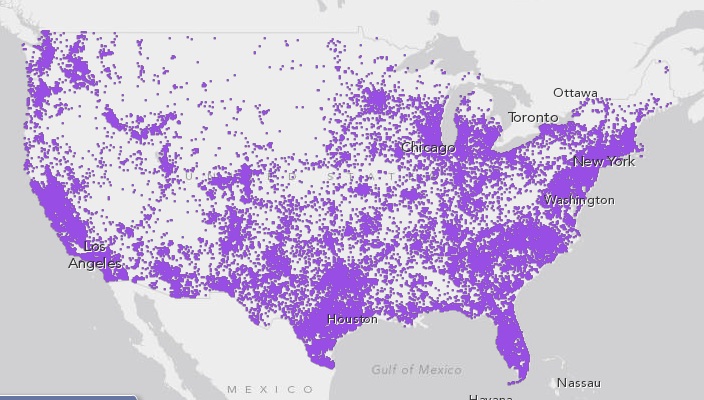
The overall message of course, is how fast Spanish and LEP folks are spreading throughout the country. Almost every court and program is impacted.
The tool includes several languages and zoom capacity, so you can zoom in onto a very local area. Here is the DC western suburbs at maximumzoom.
 Enjoy
Enjoy

